PDF Reports
UserLoop can generate a professional slide-deck-style PDF report of your survey data. Reports are a great way to share results with your team, stakeholders, or clients without giving them access to your dashboard.
Generating a Report
1. Go to Surveys and select the survey you want to report on.
2. Click the Analytics tab, then click the PDF Report button in the top-right corner.
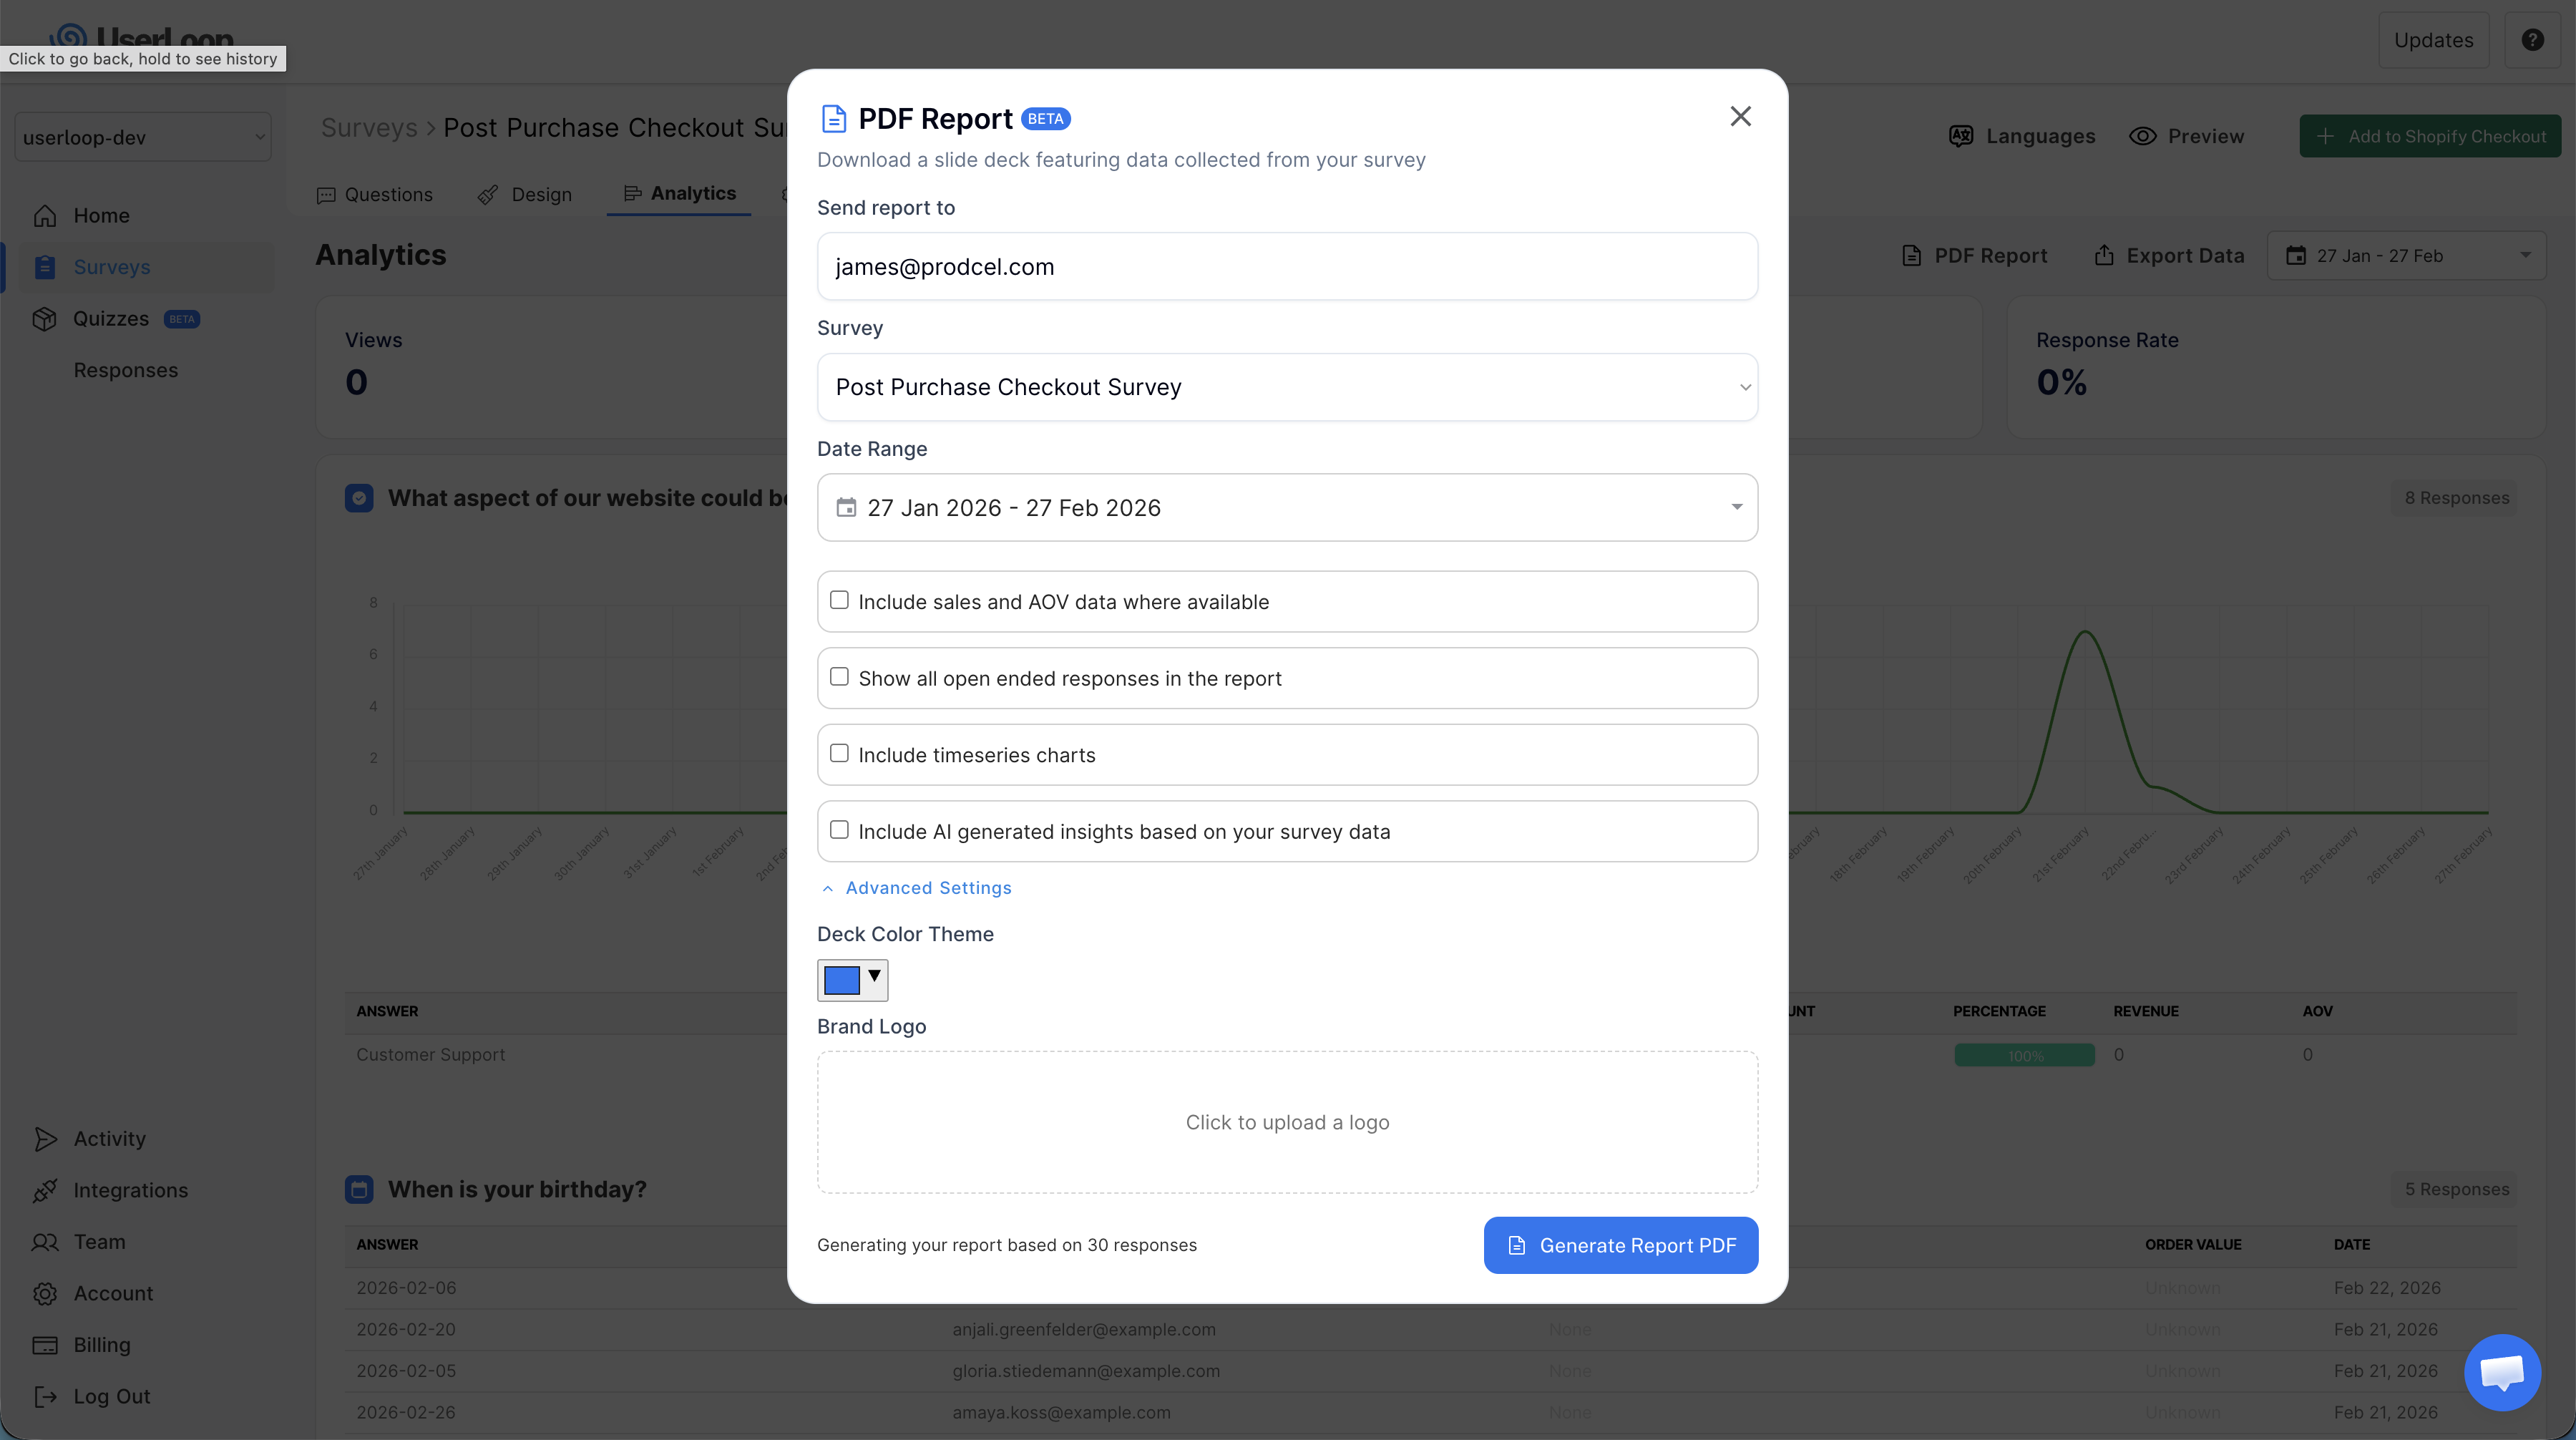
3. Configure your report settings.
4. Click Generate Report PDF. The report will be generated and sent to the email address you specify.
Report Settings
When generating a report, you can customize what's included:
- Send report to — The email address where the PDF will be delivered.
- Survey — The survey to generate the report for.
- Date Range — Filter responses to a specific time period.
- Include sales and AOV data where available — Add revenue and Average Order Value columns to answer breakdowns.
- Show all open ended responses in the report — Include every open-ended response instead of just a sample.
- Include timeseries charts — Add line charts showing how responses change over time.
- Include AI generated insights based on your survey data — Enrich the report with AI-powered topic analysis and answer insights.
Advanced Settings
Click Advanced Settings to access additional options:
- Deck Color Theme — Choose an accent color for the report. This sets the color for charts, tags, and highlights throughout the PDF.
- Brand Logo — Upload your company logo to display on the report cover page.
What's in the Report
The report is formatted as a landscape slide deck with a professional layout.
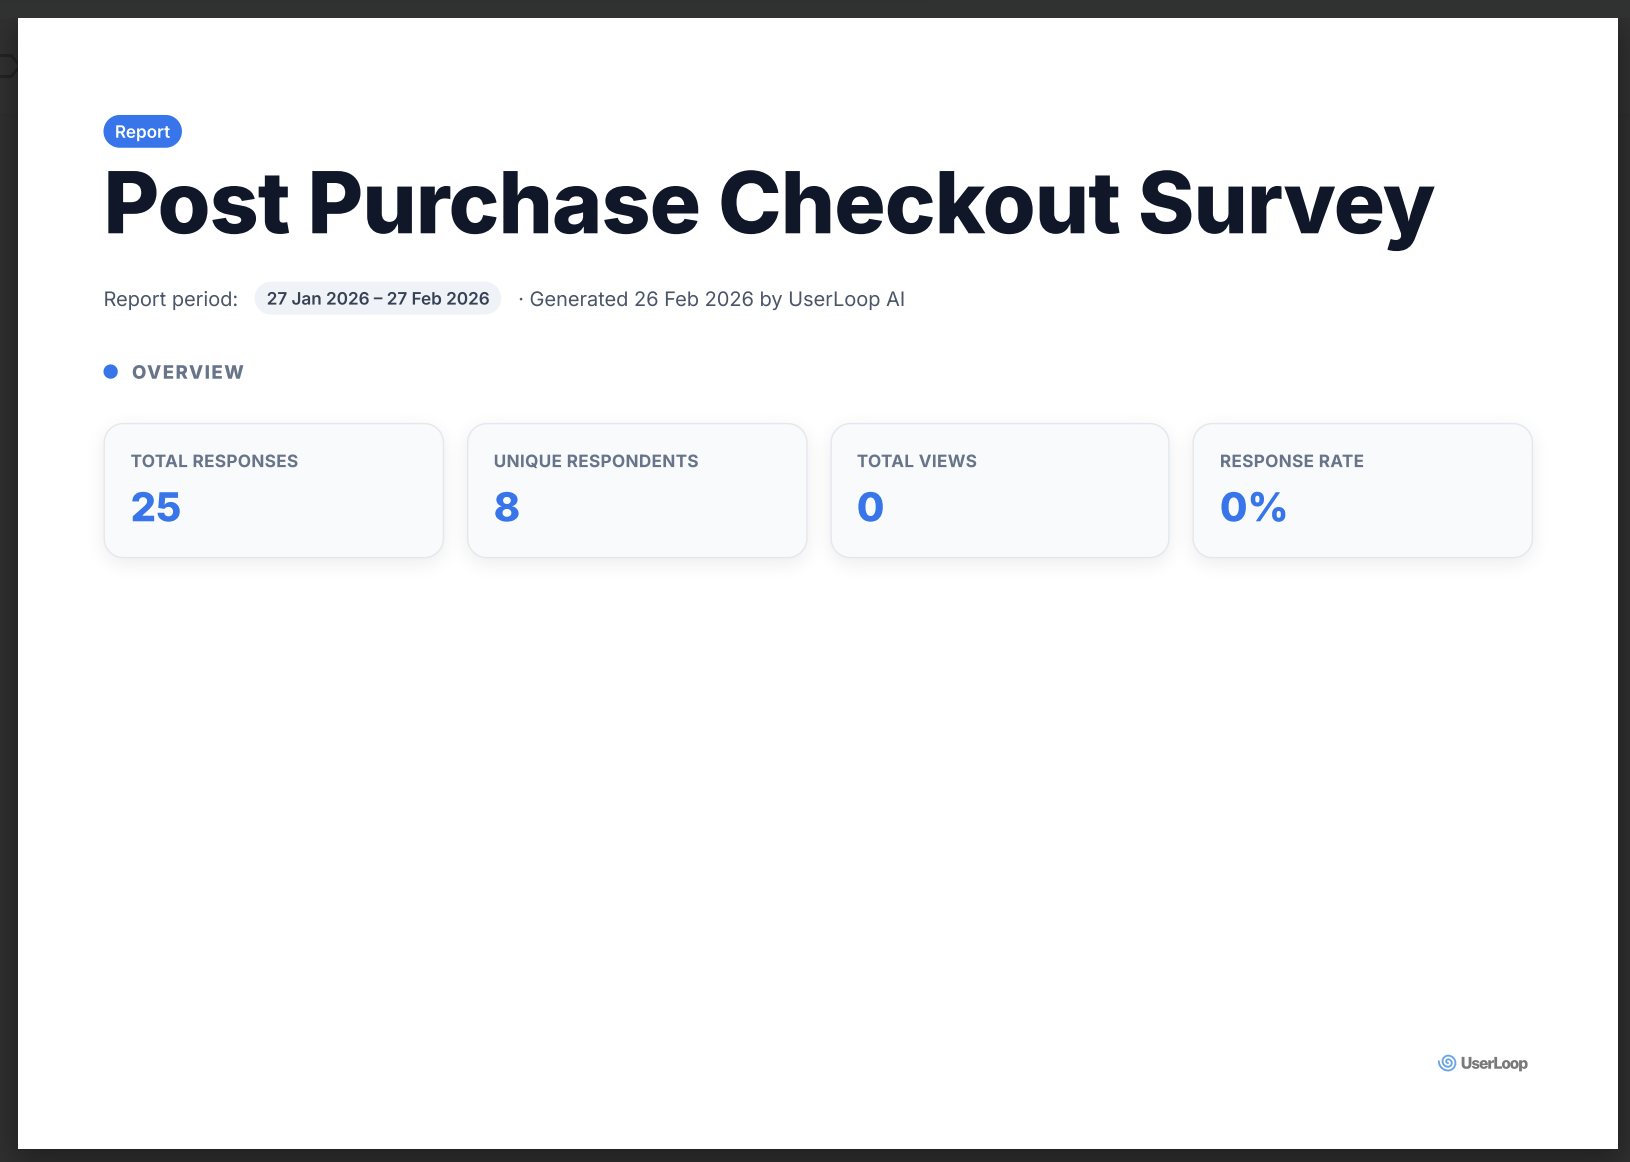
Cover page — Shows your survey name, the date range, and overview cards with key metrics: Total Responses, Unique Respondents, Total Views, and Response Rate.
Question pages — Each question gets its own page (or pages, for questions with many answers). These include:
- Answer breakdown table — Every answer option with its count, percentage (with a visual bar), and optionally Revenue and AOV.
- NPS snapshot — For NPS and Number Score questions, a dedicated card showing the NPS score, average score, and a Promoters / Passives / Detractors breakdown.
- Timeseries charts — When enabled, line charts showing how each answer option trends over time.
- Open-ended responses — A list of free-text responses, either as a sample or the complete set.
AI Insights (when enabled) — For each question, the report includes:
- Topic analysis — For open-ended questions, a bar chart of the most common themes with frequency, AOV, and sample customer quotes.
- Answer insights — For choice questions, cards showing key findings with confidence scores, business impact recommendations, supporting metrics, and sample data.
Tips
- Use date ranges to compare periods — generate one report for last month and another for the current month to spot trends.
- Enable AI insights for the richest reports. These add context and recommendations that go beyond raw numbers.
- Match your brand using the color theme and logo options so reports look professional when shared externally.
Need Help?
If you have any questions about PDF reports, reach out to us via live chat and we'll be happy to help.
Updated on: 26/02/2026
Thank you!